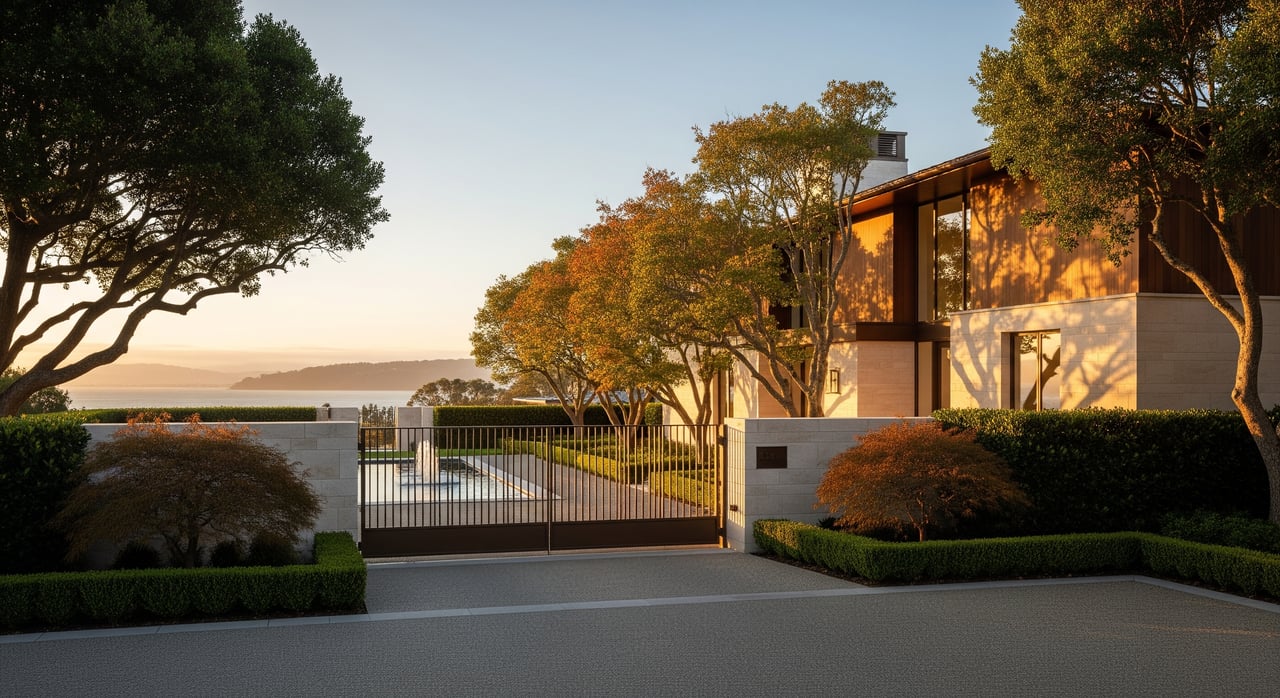
In Los Gatos right now, two of the most cited home-price trackers are describing what sound like two different markets. Zillow's home value index, updated through the end of June 2026, put the average Los Gatos home at $2,697,025, up 2.1% from a year earlier. Redfin, working from the three months of closed sales ending in May 2026, put the median sale price at $2.4 million, down 10.7% over roughly that same stretch. Same city. Overlapping windows. One number is climbing. The other is falling by double digits.
Neither site made an error. This is what happens when a relatively small number of expensive homes trade hands each month in a market that's still tight on inventory, and it matters more than a rounding error to anyone trying to decide whether Los Gatos, or Saratoga, or Willow Glen is moving toward them or away from them.
Why the same month can look like two different markets
Zillow's index estimates value across the whole housing stock and smooths the line month to month. Redfin's median is the literal midpoint of whatever happened to close in that specific window. In a city where only a few dozen homes sell in a typical month, which particular homes close, three modest ranches or three sprawling hillside estates, can swing the median by ten or fifteen percent without any real change in what buyers are willing to pay for a comparable house.
| Source | What it measures | Los Gatos figure | Direction |
|---|---|---|---|
| Zillow (updated June 30, 2026) | Estimated average home value | $2,697,025 | Up 2.1% year over year |
| Redfin (three months ending May 2026) | Median closed sale price | $2.4 million | Down 10.7% year over year |
If you searched "Los Gatos home prices" this week, you could land on either of those and walk away with an entirely wrong impression of which direction the underlying answer to your question is heading.
The same pattern shows up at the county level
Santa Clara County's own Realtor association ran into the identical split in its most recent monthly report, covering the run-up to early June 2026. The median sales price for single-family resale homes was down 2.4% year over year. The average sales price, over the same stretch, was up 4.9%, to $2,647,510. Sales volume itself rose 7.1% year over year, and homes sold at 104.6% of list price, still solidly above asking.
A falling median and a rising average in the same report almost always means the same thing: fewer sales at the very top of the market that quarter pulled the midpoint down, while the properties that did close, including some large ones, kept the average climbing. That's a shift in which homes traded, not proof that the typical Santa Clara County home got cheaper.
Zoom out to Redfin's broader countywide figure and you get the number most buyers see first: over the three months ending May 2026, the median sale price across all of Santa Clara County was $1.6 million, down 4.9% year over year, at $967 per square foot. That headline is real. It's also an average of dozens of cities with wildly different stories, and it says almost nothing about what's happening on a specific street in Santa Clara or Mountain View.
What the individual cities actually show
Santa Clara city illustrates the split at a smaller, sharper scale. Over the three months ending May 2026, the median sale price there was $1.7 million, down 3.5% from a year earlier. And yet homes in Santa Clara were selling in about 12 days and drawing four competing offers on average, giving the city a Redfin competitiveness score of 91 out of 100, among the highest anywhere in the county.
A market with a falling median rarely also produces four competing offers and a 12-day close. In Santa Clara city this year, both things were true at once, because the softness sat at the top of the price range while the middle of the market kept moving at a sprint.
Mountain View shows the same mechanism from the supply side. The city's July 2026 single-family figures, pulled directly from the regional MLS, showed a median sale price of $3,038,051, up 19.8% year over year, a sale-to-list ratio of 106%, and just 18 active listings against 0.8 months of supply. Meanwhile Redfin's broader city composite, which folds in condos and townhomes, showed prices roughly flat to slightly down over a similar window. Both readings are accurate. They're measuring different pools of homes, and with only 18 single-family listings active at any given moment, one large sale can move that median by six figures on its own.
Willow Glen, in San Jose, runs a version of the same play at the neighborhood level. It carries a Redfin competitiveness score of 82 out of 100, and homes there sell in about 10 days. A snapshot of March 2026 closings put the median sale price down 6.1% from a year earlier, while a more recent read on the average sale price showed it up more than 12% over the same twelve months. Read only the median and Willow Glen looks like it's cooling. Read the average alongside the 10-day close and it looks like what local agents describe it as: one of the steadier seller's pockets in San Jose, still pulling serious, fast-moving buyers.
Saratoga is the clearest case of a real luxury pullback layered on top of the same statistical noise. Redfin has tracked the city's median sale price down close to 15% from the year before, driven largely by fewer mega-estate closings than the county saw at the height of 2024 and 2025. Narrow in on the 95070 zip code, Saratoga's most established core, and the decline shrinks to about 4%. Homes there are still closing in roughly nine days at about 103% of list price. The citywide number captures a real drop in how many top-tier estates traded that quarter. It tells you very little about what a buyer will actually pay for a well-located four-bedroom home in central Saratoga today.
Zoom out to San Jose as a whole and the picture steadies. Over the three months ending June 2026, the city's median sale price sat at $1.5 million, down less than 1% from a year earlier, with homes selling in about 15 days compared to 14 the year before, and more homes closing than in the same month of 2025. MLS-sourced local reporting through July put the city's single-family sale-to-list ratio around 103%, a step down from the spring peak but still solidly on the seller's side of the line. That's the baseline the smaller, more volatile submarkets are swinging around, not against.
What to check before you cross a neighborhood off your list
A few habits will save you from reading these numbers backward.
Don't compare a Zillow figure in one city to a Redfin figure in another. The two platforms don't measure the same thing even within their own city pages, as Los Gatos shows in a single month.
Ask for days-on-market and sale-to-list ratio for the specific neighborhood or zip code you're weighing, not just the citywide median. Those two numbers move together in a genuine slowdown. When one stays fast and tight while the median drops, the story is usually about which price tier happened to sell, not about buyer demand disappearing.
In smaller cities or tight zip codes, Los Gatos, Saratoga's 95070, Mountain View's single-family segment, a handful of closings can swing a monthly median 10% or more with no real change underneath it. Six months of data tells you more than one month's headline ever will. For a longer, less noisy view of where Santa Clara County has actually been heading, the Federal Reserve's house price index for the county smooths out the month-to-month swings that trip up a single Zillow or Redfin snapshot, and the county Realtor association's own monthly housing stats are worth a direct look before you let a single number talk you out of a neighborhood you actually like.
FAQ
Is Santa Clara County a buyer's market right now? Not uniformly. County-wide medians have softened, largely because fewer top-tier estate sales closed compared with 2024 and 2025. But days-on-market and offer counts in cities like Santa Clara, Mountain View, and Willow Glen still describe a seller-favorable pace.
Why do Zillow and Redfin show different numbers for the same city? Zillow's home value index estimates value across the entire housing stock and smooths it over time. Redfin's median is the literal midpoint of that period's closed sales. In smaller cities with fewer monthly transactions, that difference can point in opposite directions in the same month.
Should I wait for prices to fall further before making an offer? A falling median in one report doesn't guarantee a falling price in the specific neighborhood you're targeting. Check the days-on-market and sale-to-list ratio for that neighborhood over the last two or three months before deciding whether waiting actually buys you anything.
If you're weighing two or three Santa Clara County cities against each other and the numbers you're finding online don't seem to agree with each other, that's usually not confusion on your part. It's the market. Chris A. Sabido has spent two decades reading these submarkets past the headline number, and can walk you through what's actually happening in the specific neighborhoods on your list. Book an appointment to get the real picture before you rule anything out.